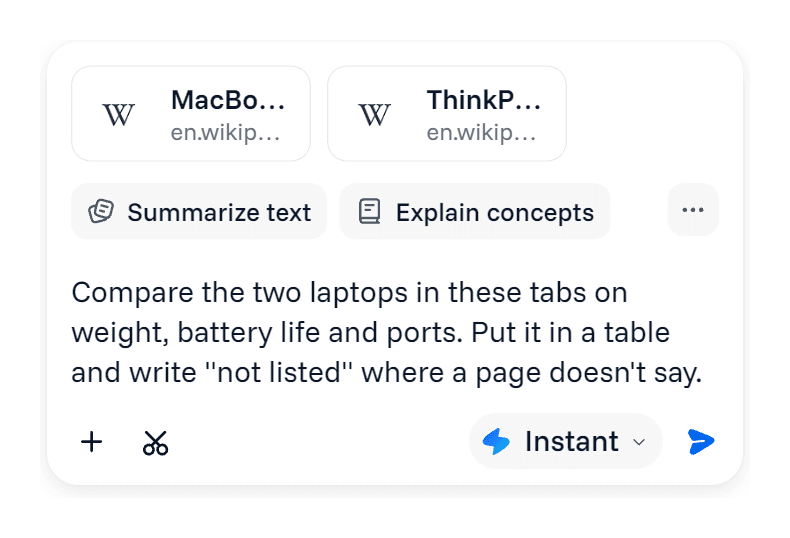
The thing you want to ask about is a chart in a dashboard, a diagram inside a slide deck, or one frame of a tutorial video. You can't select any of it as text. The usual workaround is to take a screenshot, save it, open a chat tab and upload it. You can ask AI about a screenshot without any of that: draw a box around the part of the screen you mean, right beside the page, and ask in the sidebar.
Draw a box from the sidebar.
Open the Lensia sidebar from the toolbar icon or with Ctrl+Space, then go back to the page:
- Press
Ctrl+Shift+X(Command+Shift+Xon a Mac). - Drag a box around the chart, diagram or frame.
- The selection appears in the sidebar composer as an image. Nothing is sent yet.
- Type your question and send it.
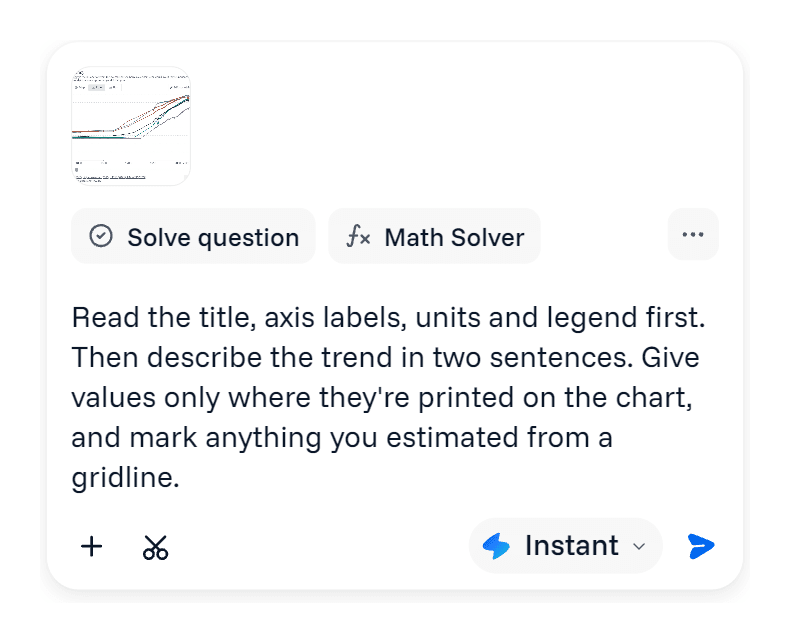
Only the region you drew is sent, not the rest of the tab; the extension safety guide lists what each part of Lensia sends. If you'd rather click than use the shortcut, the composer's + menu has Select from screen, and so does the Lensia button at the bottom right of the page. All three put the image in the same composer.
Because the selection waits in the composer, you can draw a second box before you send. That's useful when the question is about two things at once, like a chart and the table it was built from.
Keep the box tight and say what it shows.
A tight box gets a better answer than a whole screen, because small text inside a big selection can come out too blurry for the model to read. If a chart has a small legend, capture the chart with its legend and leave the page header and sidebar ads out.
Say what the image is, too. "A screenshot" tells the model nothing about whether it's looking at a sales dashboard or a lab result. One line of context fixes that:
This is the weekly signups chart from our analytics dashboard. The dip is in week 3. What could explain a drop like that, given only what the chart shows?
Read a chart without trusting every number.
Models are good at describing the shape of a chart, and less reliable at reading exact values off it. Ask for the labels before the numbers:
Read the title, axis labels, units and legend first. Then describe the trend in two sentences. Give values only where they're printed on the chart, and mark anything you estimated from a gridline.
That prompt gets you an answer you can check. If a number matters, check the numbers against the source: hover over the chart for its tooltip, or open the table behind it. A misread gridline looks just as confident as a correct one.
For a chart inside a PDF report, attach the PDF for the surrounding text and footnotes, and draw a box around the chart as well, so the model has both the numbers in the text and the picture. The PDF summarizer guide covers asking about tables and their units.
Pause the video on the frame you need.
A capture is one still image, so stop on the frame that holds what you're asking about:
- Pause the video and scrub to the exact moment, such as the step where the tutor writes the formula or the instructor shows a setting.
- Press
Ctrl+Shift+Xand draw a box around the frame, or just the part of it you care about. - Ask about what's visible in that frame.
This is a paused frame from a baking tutorial at 0:21. What is being added to the bowl here, and roughly how much?
If your question is about what someone said rather than what's on screen, a frame won't help. Open the video's transcript, if the site offers one, and paste the section into the composer instead.
Ask about diagrams, error messages and photos.
The same box works on anything you can see but can't select:
- A diagram in your course slides: "Explain what each arrow in this diagram represents, and which step depends on the one before it."
- An error dialog or a terminal in a screen-shared demo: "What does this error mean, and what's the first thing to check?"
- A product photo: "What connectors are visible on the back of this monitor?"
The study guide walkthrough shows how to turn an explanation like that into notes you can test yourself on.
Use the floating panel for a quick answer.
With the sidebar closed, the same Ctrl+Shift+X opens Lensia's floating panel instead, and the answer streams in as soon as you finish drawing. It's the faster option for a one-off question, such as what the plant in someone's photo is. To type the question before anything is sent, press Ctrl+Shift+E to open the panel, add the selection with its + button, then type and send.

When a quick answer turns into a longer conversation, click Continue in Chat. The sidebar opens with your question, the answer and the image, and you carry on from there.
Pick a plan when a session runs short.
Screen selection works on every plan. Free answers at Instant effort with limited usage. Basic gives you more usage and higher effort for a hard diagram, and Pro gives you even more. Compare the plans when a free session runs short.
Add Lensia to Chrome, open the sidebar, and draw a box around the next chart you're squinting at.